Using Math.js and Plotly.js, you can draw graphs of arbitrary math functions pretty easily. Below is a quick demo of 4·sin(x) + 5·cos(x/2) from -10 to 10, plus the code behind it.
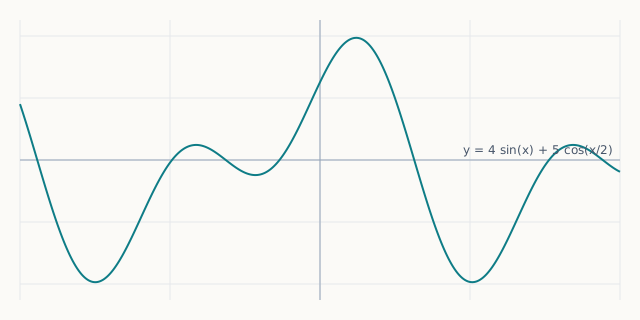
The original post had a live text box + Draw button that re-plotted any expression you typed. On the new static build the plot is pre-rendered for the default equation; the code below still works if you want the interactive version back.
For React, first include the dependencies.
"mathjs": "^7.6.0",
"plotly.js": "^1.57.1",
"react-plotly.js": "^2.5.0",
Then import them in your component:
import Plot from 'react-plotly.js';
import { compile } from 'mathjs';
When the button is clicked, use math.js to prepare function values. In this example, x ranges from -10 to 10 with a step of 0.01.
const handleDraw = () => {
  try {
    const expr = compile(equation);
    var yVals = [];
    var i;
    for (i = -10; i < 10; i += 0.01) {
      yVals.push(expr.evaluate({ x: i }));
    }
    setYValues(yVals);
  } catch (err) {
    setErrorMessage(err.message);
  }
};
Render the graph:
<Plot
  data={[
    {
      x: xValues,
      y: yValues,
      type: 'scatter',
    },
  ]}
  style={{ width: '100%', height: '100%' }}
/>
And for reference, here is the plain-HTML version — no React required:
<!DOCTYPE html>
<html lang="en">
  <head>
    <meta charset="utf-8" />
    <title>math.js | plot</title>
    <script src="https://unpkg.com/mathjs@7.1.0/dist/math.min.js"></script>
    <script src="https://cdn.plot.ly/plotly-1.35.2.min.js"></script>
    <style>
      input[type="text"] {
        width: 300px;
      }
      input {
        padding: 6px;
      }
      body,
      html,
      input {
        font-family: sans-serif;
        font-size: 11pt;
      }
      form {
        margin: 20px 0;
      }
    </style>
  </head>
  <body>
    <form id="form">
      <label for="eq">Enter an equation:</label>
      <input type="text" id="eq" value="4 * sin(x) + 5 * cos(x/2)" />
      <input type="submit" value="Draw" />
    </form>
    <div id="plot"></div>
    <p>Used plot library: <a href="https://plot.ly/javascript/">Plotly</a></p>
    <script>
      function draw() {
        try {
         // compile the expression once
          const expression = document.getElementById("eq").value;
          const expr = math.compile(expression);
         // evaluate the expression repeatedly for different values of x
          const xValues = math.range(-10, 10, 0.01).toArray();
          const yValues = xValues.map(function (x) {
            return expr.evaluate({ x: x });
          });
          // render the plot using plotly
          const trace1 = {
            x: xValues,
            y: yValues,
            type: "scatter",
          };
          const data = [trace1];
          Plotly.newPlot("plot", data);
        } catch (err) {
          console.error(err);
          alert(err);
        }
      }
      document.getElementById("form").onsubmit = function (event) {
        event.preventDefault();
        draw();
      };
      draw();
    </script>
  </body>
</html>